
The chip's placement and routing ran on one laptop: an Intel Core Ultra 7 155H with 22 threads and 30 GB of RAM. Three small machines on Slurm took some of the lighter jobs. This last post is about what that meant in practice: the limits we set, where the hours went, the twenty tries it took to get through routing, and what we'd change with more hardware.
The limits
Three limits held for the whole project:
- One EDA job at a time. Two 20 GB jobs don't fit in 30 GB.
- 10 threads per job, set explicitly in every tool.
- A 22 GB memory cap per job, with swap off. Each job ran under
systemd-run --user --scope -p MemoryMax=22G -p MemorySwapMax=0. A job over the cap dies quickly with a clear out-of-memory error instead of swapping the laptop to a standstill. For the chip's routing we raised the cap to 26 GB, only after the engineer agreed.
On Slurm, --mem only steered scheduling and wasn't enforced. The small nodes had at most about 15 GB, below the 20 GB-plus that chip and otbn jobs needed. So we picked the node by the job's expected peak memory, and the big jobs stayed on the laptop.
Where the hours went
Chip v5, stage by stage, from each run's GNU time log. "Cores used" is CPU time divided by wall time: how many of the 10 threads were busy on average.
| Stage | Wall time | Cores used | Peak memory |
|---|---|---|---|
| init | 4 min | 1.2 | 4.4 GB |
| floorplan | 8 min | 1.0 | 5.1 GB |
| place | 2 h 51 min | 1.6 | 15.8 GB |
| CTS | 6 min | 1.5 | 9.7 GB |
| post-CTS repair | 34 min | 2.8 | 17.5 GB |
| route | 26 h 12 min | 8.9 | 22.4 GB |
| post-route | 12 min | 1.3 | 20.1 GB |
| finish (light) | 8 min | 0.3 | 6.1 GB |
| extraction (OpenRCX, 4 corners) | 30 min | 0.8 | 3.7 GB |
| signoff STA (OpenSTA, per corner) | 3 min | 2.2 | 5.9 GB |
Two patterns stand out:
- Placement and its repairs run mostly on one core. The chip's placement used 1.6 cores on average; the flat chip's 24.7-hour placement was 22.5 hours of single-threaded
repair_design(part 2). More cores wouldn't have helped there. Hierarchy did. - Detailed routing uses all the threads and the most memory. It is the only step that kept about 9 of 10 threads busy, and it set the memory peak. The largest block behaved the same way: otbn's route took 6 hours on 9.4 cores at 19.5 GB.
Signoff is cheap by comparison. Once the files exist, extraction takes half an hour and a timing run takes minutes, so re-running signoff after a fix is easy.
Twenty tries, mostly memory
After placement, chip v5 needed twenty tries to get through its last five stages. Most failures were out-of-memory errors at the cap, not crashes or wrong results:
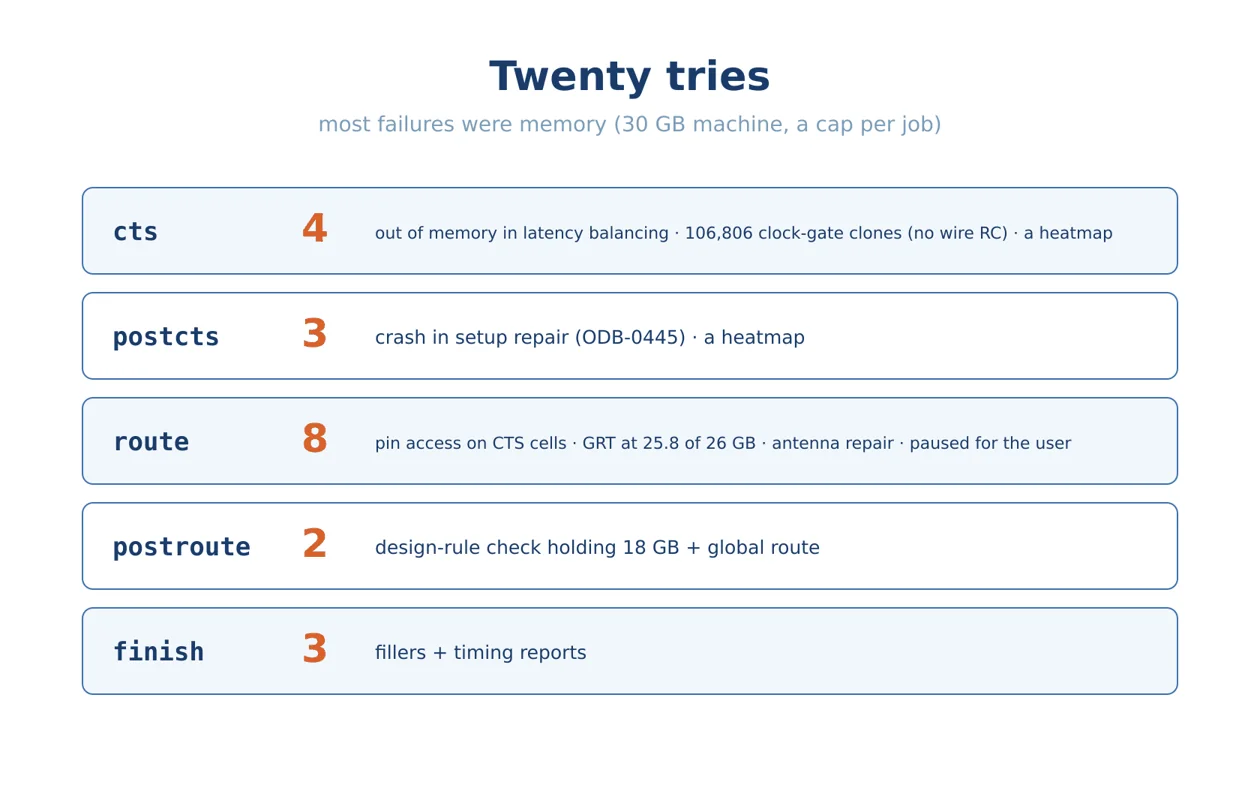
Some highlights:
- A missing wire model made CTS clone 106,806 clock gates. The fix was one
set_wire_rcline. - Global routing peaked at 25.8 GB against a 26 GB cap.
- A design-rule check in post-route held 18 GB of data while global routing was still loaded.
- Heatmaps, antenna repair and the finish stage's fillers plus timing reports each pushed a run over the cap.
- Once, the engineer needed the laptop back, so the route was paused in its first pass and resumed later from the saved global-route result.
Each failure changed the flow for good:
- Global and detailed routing run as separate processes, with the global-route result saved in between.
- No heatmaps on the chip.
- Checkpoints before reports, so a report that runs out of memory doesn't lose the result.
- A light finish without fillers, and post-route without the full design-rule check.
- Antenna repair off for the demonstration, written down as a leftover.
None of these are exotic. Together they decided whether a million-cell top level fits on a 30 GB machine at all.
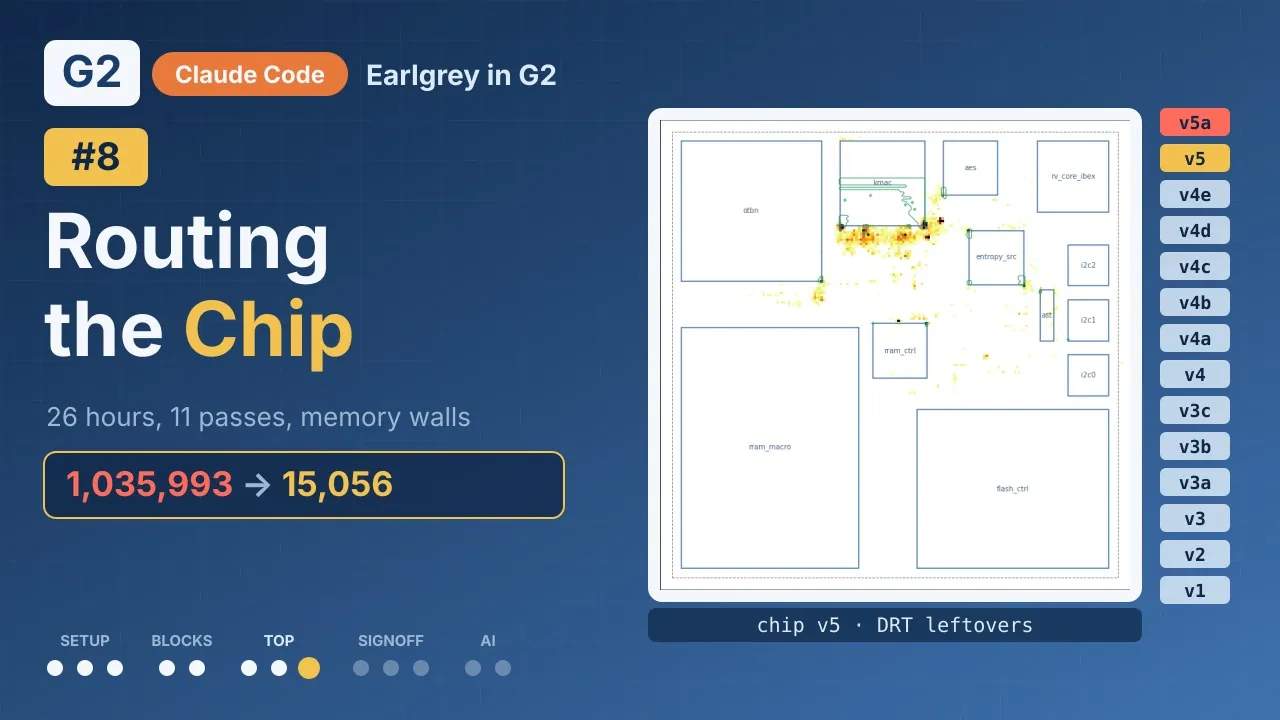 2:09
Watch on YouTube ↗Watch on Bilibili ↗
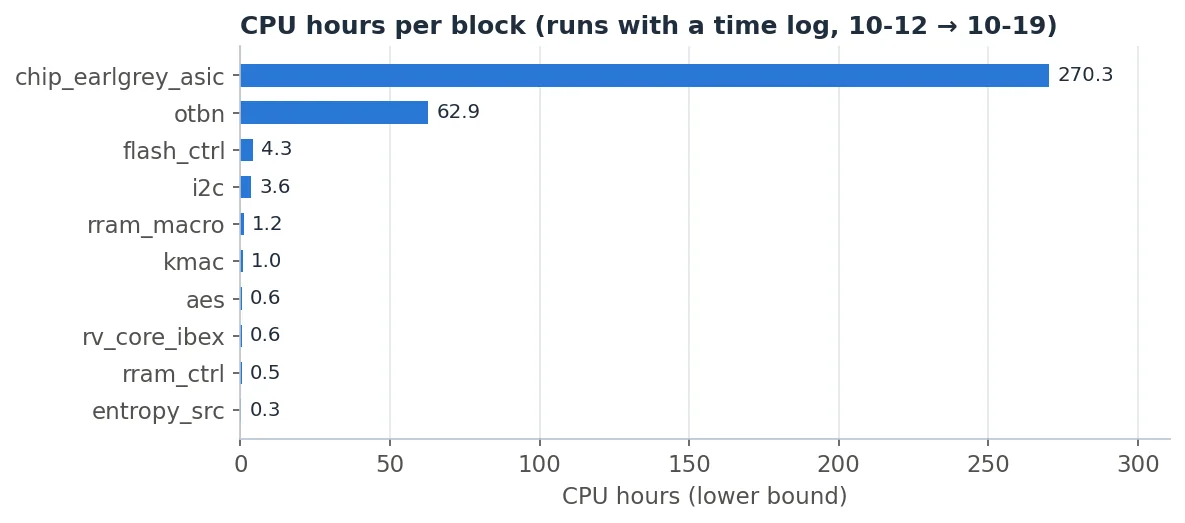
The total
The total is a lower bound. Time logs exist only from 12 October on and keep only the last run of each stage, so the flat chip's 24.7-hour placement, most early block runs and every failed try are missing.
When more machines would help, and when they wouldn't
More memory would have saved the most time. Most of the twenty tries were memory, not speed. A 64 GB machine would have avoided most of them, along with the process splitting and the cap negotiations.
More machines help with independent jobs:
- The nine blocks took about 20 hours of place and route one after another. On machines with enough memory they could run side by side. Small blocks such as i2c, aes and kmac fit on a 15 GB node; otbn's route (19.5 GB) and some finish stages (about 22 GB) don't.
- The four level-2 floorplan checks (part 3) took about an hour each and peaked near 20 GB. With four big enough nodes they would take one hour instead of four.
- Probes and signoff runs are small and fit anywhere. The congestion probe ran on a Slurm node in 15 seconds.
More machines don't shorten one long run. The 26-hour detailed route is one process on one machine, already using about 9 cores. Placement is mostly serial. What shortened those was design: hierarchy took placement from 24.7 hours to 2.8, and a better floorplan (fixing the kmac channel) is what would shorten the route.
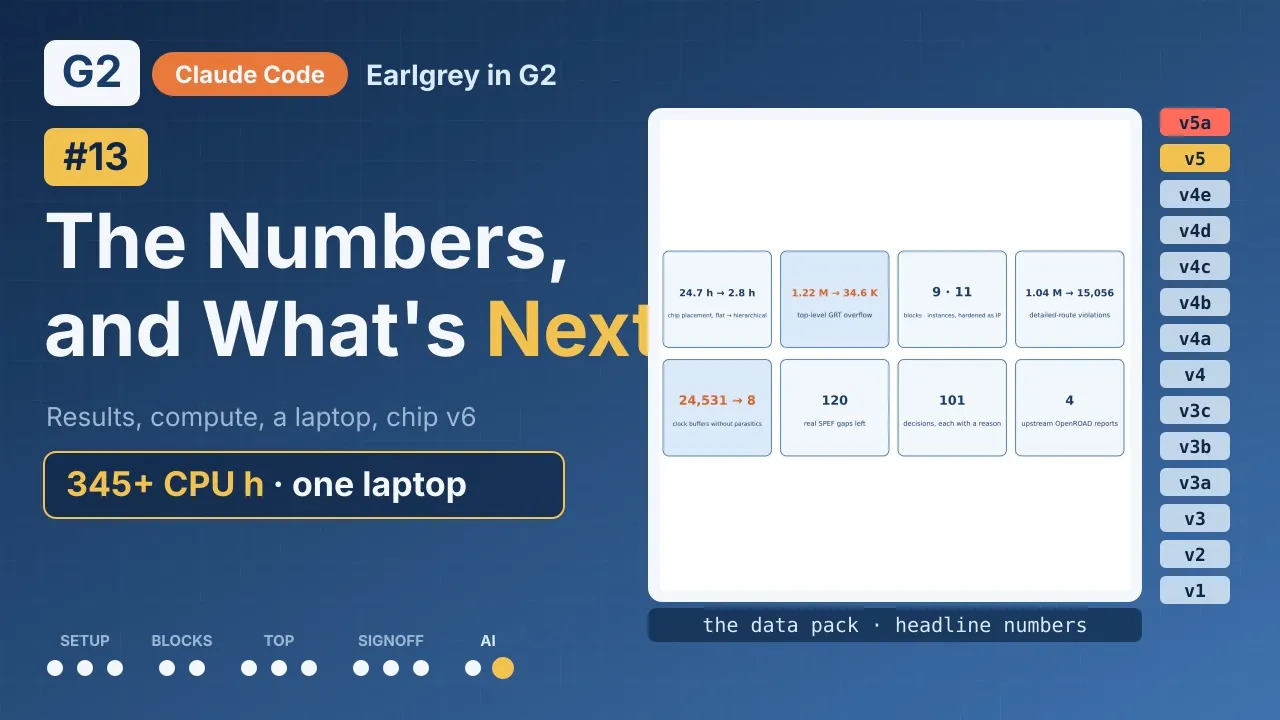
The series in one screen
Here is everything the series showed:
 1:38
Watch on YouTube ↗Watch on Bilibili ↗
Still not a tape-out
As we've said throughout: the upper metals are a stand-in 10-metal stack, the memories are FakeRAM models, the clock is a 10 MHz demonstration target, and the chip has leftovers. Those leftovers are 15,056 routing violations, IO paths without timing exceptions, no hold report and the open VDD connection at the pad ring. Chip v5 also mixed two OpenROAD builds and a patched database.
The next chip version, v6, closes those gaps:
- Power-grid connections to the pad layers, with VDD and VSS both checked.
- The kmac channel reworked, and checked with the worst-window rule before routing.
- Timing exceptions for the IO paths.
- Hold reports in signoff.
- One OpenROAD build for the whole run, with no patches.
Where to find it
- G2: the free Community Edition on GitHub
- The videos: “Earlgrey in G2”, 13 episodes, on YouTube and Bilibili
- The OpenROAD fixes: issues #11839 and #11840, pull requests #11841 and #11842
Open-source tools can take a million-cell SoC from RTL to signoff timing. With a flow manager that keeps track of everything, an agent that works inside its rules and an engineer who makes the calls, it is a project you can run, explain and repeat on a laptop.